Graphing Quadratic Functions
Rozina Essani
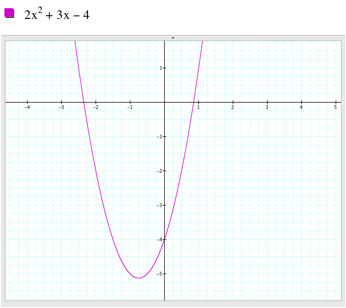
4. Graph the parabola y = 2x2+3x-4
i. Overlay a new graph replacing each x by (x - 4)
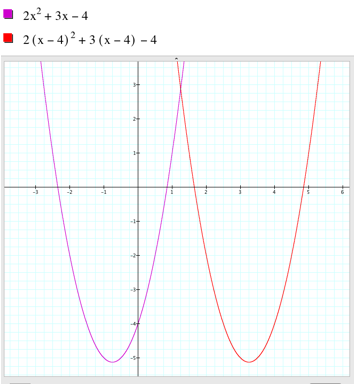
When x is replaced with (x-4) the original graph shifts to the right 4 units. This shows that adding/subtracting a constant to/from x allows the graph to shift left/right respectively.
In order to change the graph so that its vertex is in the second quadrant we need to make sure that the parabola’s vertex is on the left of x=0 and above y=0. We can represent this on the original equation as well as on the shifted equation.
Original equation:
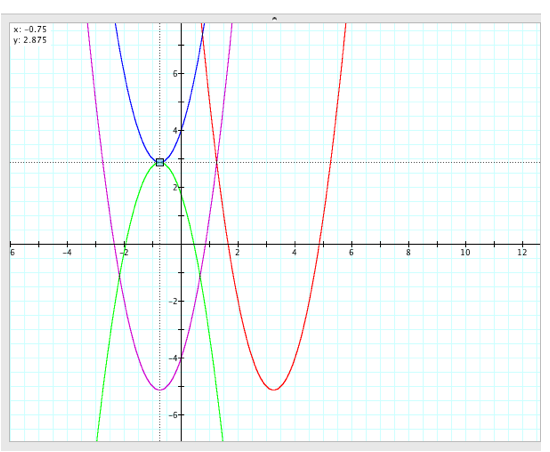
Since the vertex of the original curve was on the left of x=0 we needed only to change the value of c > 0.
The above graph also shows the concave downwards equivalent of y=2x2+3x+4. To find the concave downwards graph we must negate a and b, hence a=-2 and b=-3. To find the value of c for the concave downward graph we must look at the y=2x2+3x+4 and find (h,k) (its vertex point). The concave downward graph will contain the same point as its vertex allowing us to find the value of c.
Let us see how the graph behaves when we apply the same procedure to the shifted curve:
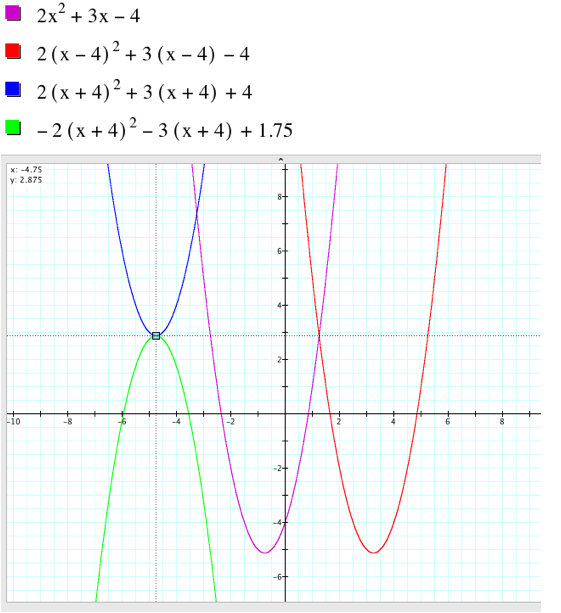
We can see that even with the shifted parabola we have the same value of c for the concave downward curve. Hence the addition or subtraction of a constant to or from x does not have an effect on the graph when moved to the second quadrant or its concave downward curve. The change is only in the x value depending on the amount that is added or subtracted.